Neutron star plot
Based on Dany Page’s excellent work here. The python code
is in nstar_plot.py which also uses some of the functions in
load_crust.py. Because matplotlib has a hard time
rendering the fills properly, the PNG output uses the ImageMagick
utility convert.
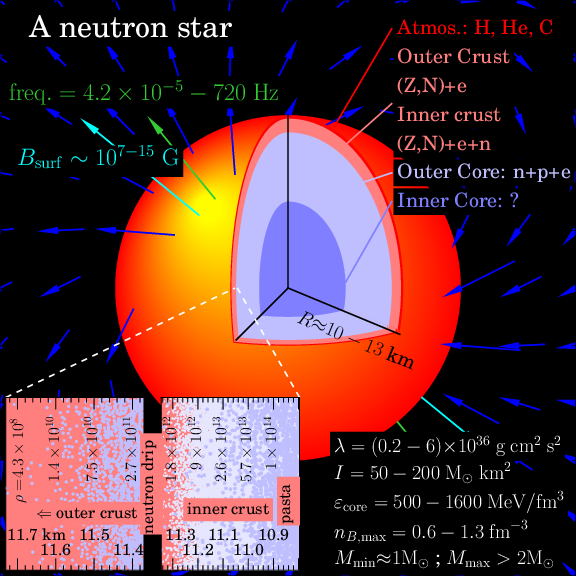
The limits on the magnetic field come from a maximum of \(B=2 \times 10^{15}~\mathrm{G}\) for SGR 1806-20 [Woods07] and the minimum from estimates using the \(P-\dot{P}\) diagrams in [Karako-Argaman15].
The slowest rotation rate is \(4.2 \times 10^{-5}~\mathrm{Hz}\) for magnetar 1E 161348-5055 in [DAi16] (see also \(0.085~\mathrm{Hz}\) for 1E 1841-045 in [Dib14]), and the fastest observed rotation rate is \(716~\mathrm{Hz}\) for PSR J1748-2446ad in [Hessels06].
The radius range in the cutaway is taken from [Steiner16ns].
The crust properties are from the SLy4 model in [Steiner12dc].
The limits on the tidal deformability, moment of inertia, core energy density, and core baryon density are taken from [Steiner15un].
The python code contains several options which can be easily changed to change the look of the plot.